Der weltweite Titanmarkt wird auf etwa $24–32 Milliarden im Zeitraum 2025–2026, je nachdem, ob in der Zahl Titandioxid (TiO₂) als Pigment enthalten ist oder nur Titanmetall und Titanlegierungen. Die zuverlässigste Schätzung, die ausschließlich Metall berücksichtigt (MarketsandMarkets), beziffert den Markt auf $24,84 Milliarden im Jahr 2025, und stieg auf $29,87 Milliarden bis 2030 bei einem 3,81 TP3T CAGR. Umfassendere Schätzungen, die die gesamte Wertschöpfungskette einbeziehen, belaufen sich auf $50+ Milliarden. Die Luft- und Raumfahrt sowie die Verteidigungsindustrie dominieren die Endnutzung bei 51,61 TP3T Marktanteil; der medizinische Bereich ist der am schnellsten wachsende Anwendungsbereich bei 6,151 TP3T CAGR bis einschließlich 2031. China kontrolliert mittlerweile etwa 75% der weltweiten Titanmetallproduktion, was für westliche Abnehmer ein Risiko in der Materialversorgungskette darstellt. Titanpulver für die additive Fertigung ist das am schnellsten wachsende Teilsegment, dessen Marktvolumen auf 14.82% CAGR bis einschließlich 2034.
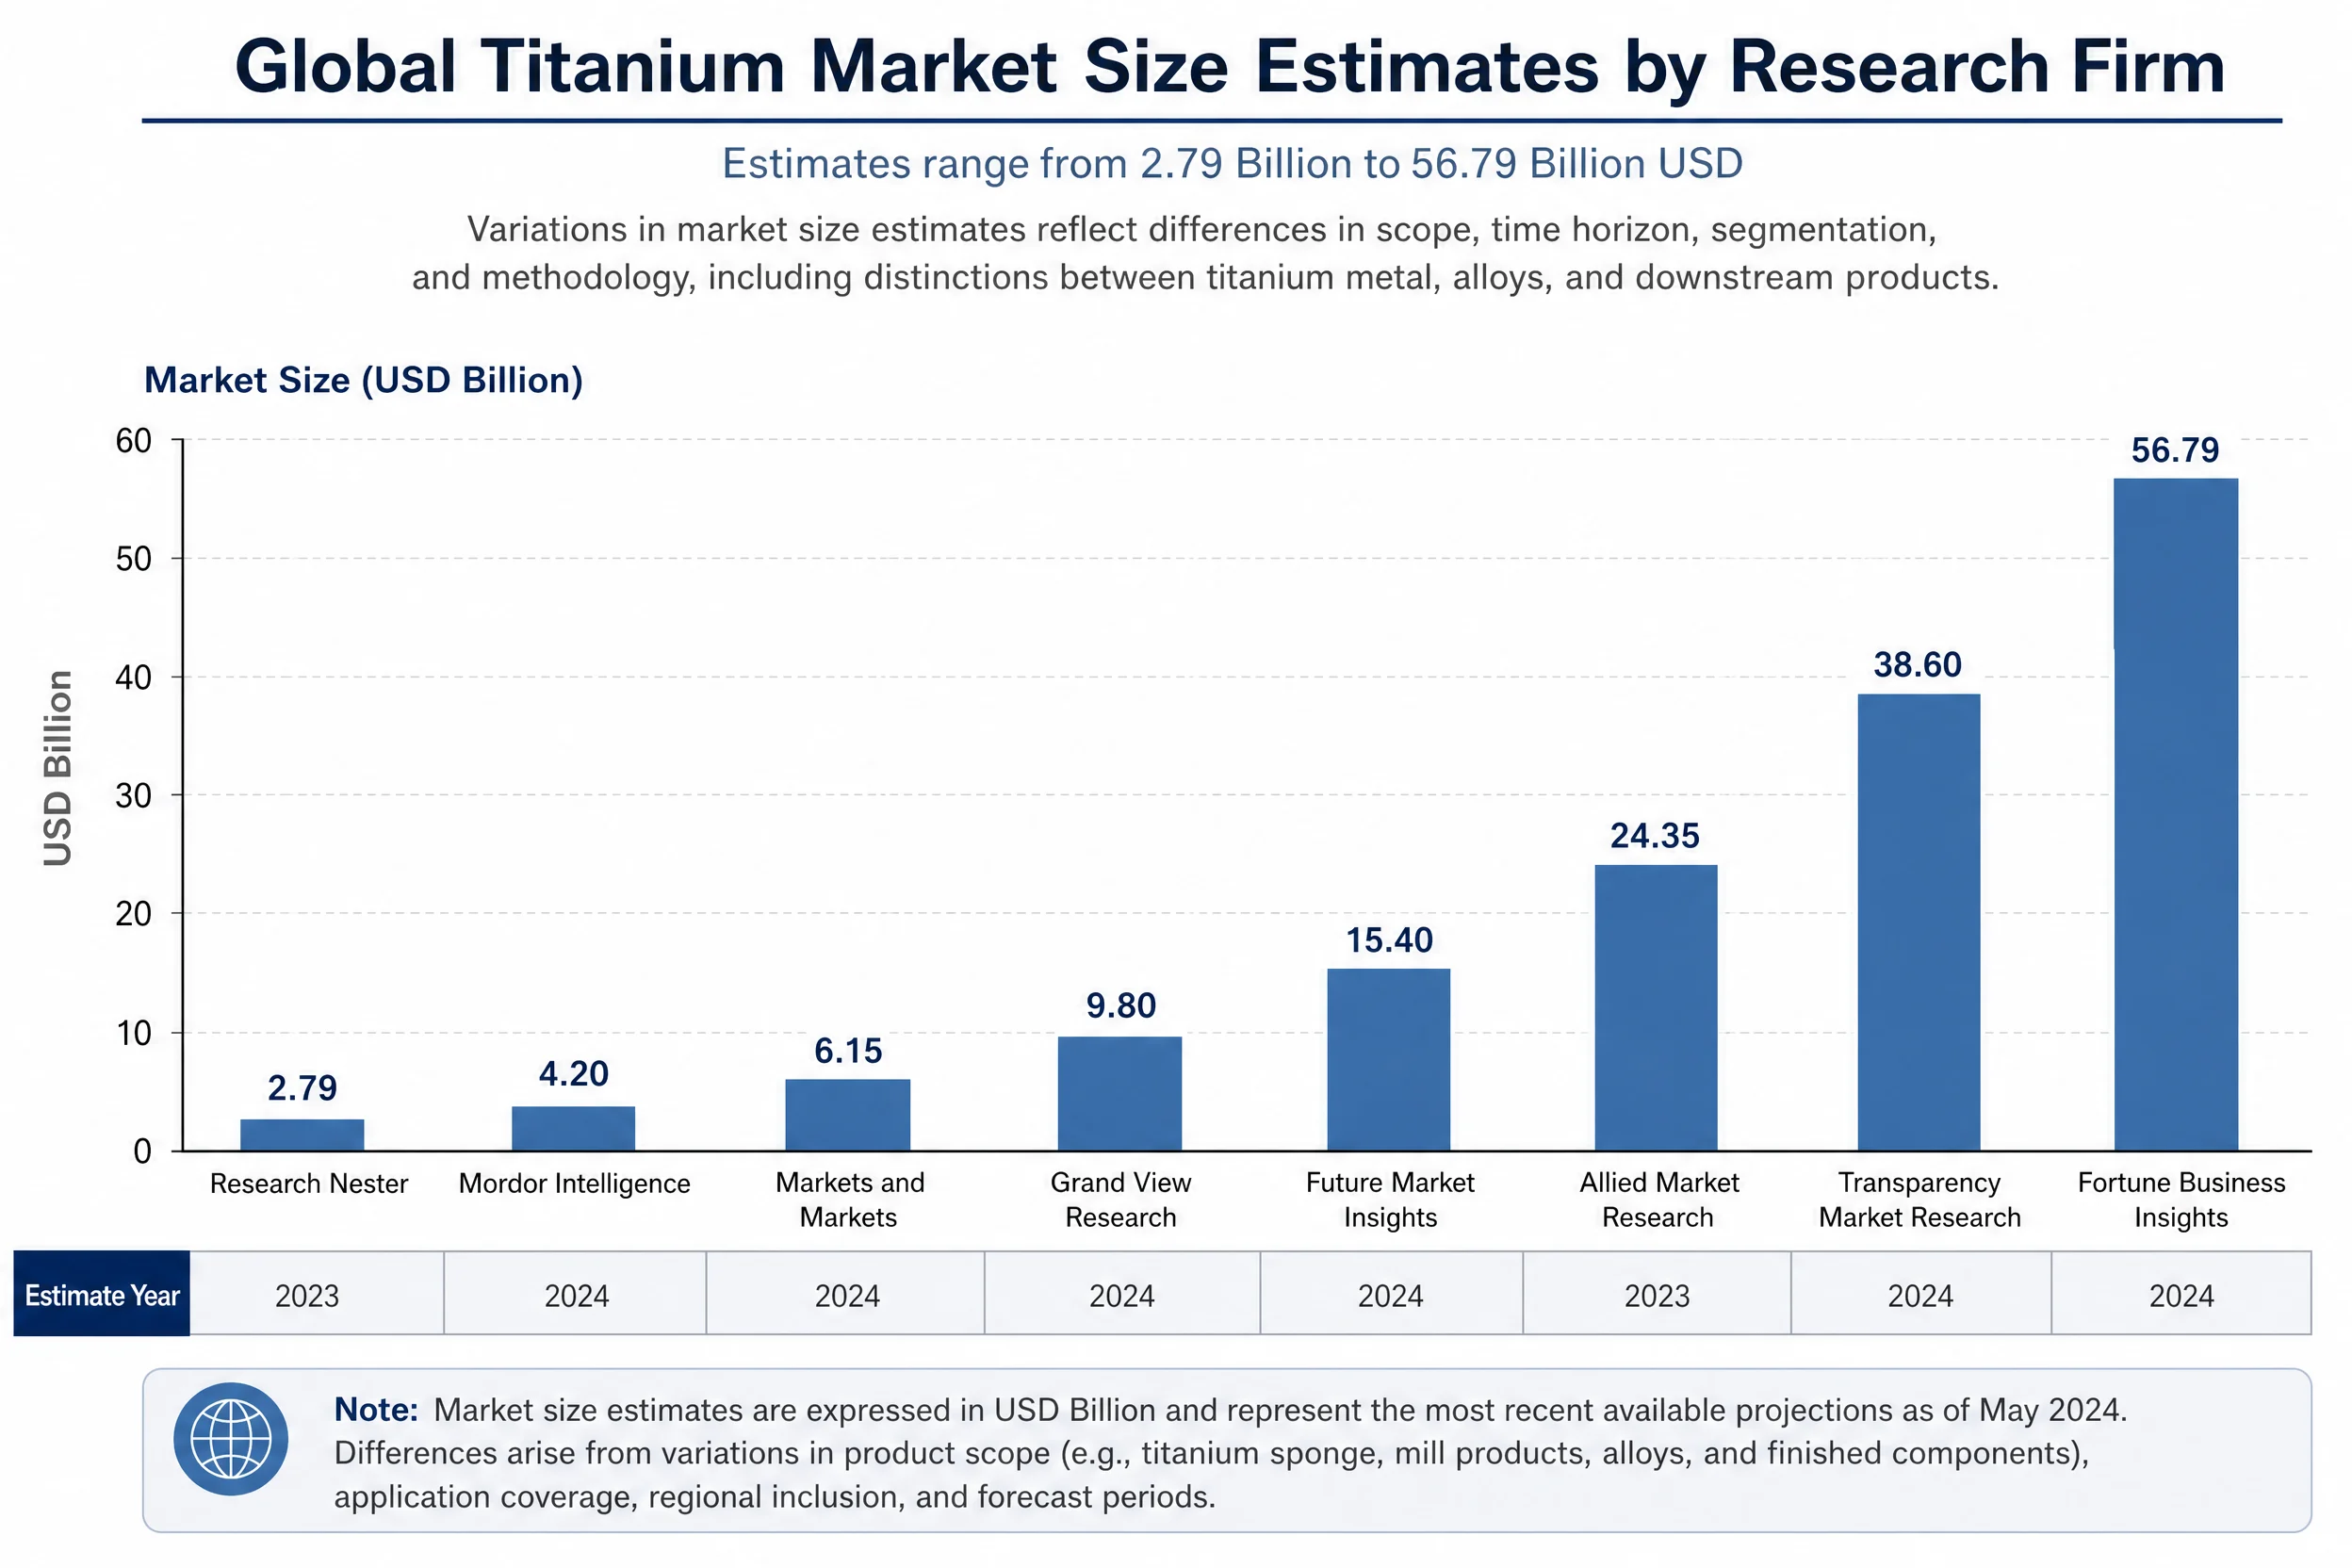
Das Problem der Datenabweichungen: Warum Marktberichte Werte von $3B bis $57B angeben
Das Erste, was jedem Analysten oder Beschaffungsfachmann bei der Untersuchung des Titanmarktes auffällt, ist, dass die Zahlen überhaupt nicht übereinstimmen. Man findet Zahlen, die für im Wesentlichen dasselbe Jahr zwischen $2,79 Milliarden und $56,79 Milliarden schwanken.
Bei der Durchsicht von acht wichtigen Marktforschungsberichten für diese Analyse zeigt sich, dass die Abweichungen nicht zufällig sind. Sie lassen sich auf drei unterschiedliche Definitionen des Untersuchungsumfangs zurückführen:
| Definition des Anwendungsbereichs | Typische Marktgröße (2025) | Beispielunternehmen, die diesen Anwendungsbereich nutzen |
|---|---|---|
| Ausschließlich Titanmetall und Titanlegierungen | $2,8B – $6,2B | Fortune Business Insights, IMARC, Persistence |
| Vollständige Wertschöpfungskette für Titanmetall (Rohmaterial → Mühlenprodukte → Endprodukte) | $24B – $32B | MarketsandMarkets, Mordor Intelligence |
| Titanmarkt einschließlich TiO₂-Pigment | $30B – $57B | Precedence Research, Datamintelligence |
Der aussagekräftigste Maßstab für industrielle Einkäufer ist die Zahl zur gesamten Metall-Wertschöpfungskette. MarketsandMarkets, eines der am häufigsten zitierten B2B-Marktforschungsunternehmen, beziffert dies auf $24,84 Milliarden im Jahr 2025, und stieg auf $29,87 Milliarden bis 2030. Das ist die Zahl, die die meisten Beschaffungsteams in der Luft- und Raumfahrt sowie in der Industrie verwenden sollten, wenn sie intern Angaben zum Marktvolumen machen.
Der Markt für TiO₂-Pigmente (Farben, Papier, Kunststoffe) ist real und groß – aber es handelt sich um eine völlig andere Lieferkette, andere Abnehmer und eine andere Preisdynamik. Wenn man ihn mit einbezieht, klingt der “Titanmarkt” zwar eindrucksvoller, aber das ist nicht hilfreich, wenn man eine Legierung der Güteklasse 5 für Flugzeugbauteile beschafft.
Unterm Strich: Wenn Sie den Begriff “Marktvolumen für Titan” sehen, sollten Sie stets die Fußnote zur Methodik überprüfen. Falls der Bericht keine solche Fußnote enthält, sollten Sie die Zahl mit Vorsicht betrachten.
Umfang des globalen Titanmarktes im Jahr 2026: Die Konsensschätzung
Lässt man die Verzerrung durch TiO₂ einmal außer Acht, so zeigen die Daten für den Kernmarkt für Titanmetall und Titanlegierungen im Jahr 2026 tatsächlich Folgendes:
| Datenquelle | Wert 2025 | Schätzung für 2026 | CAGR (bis 2030/2031) | Umfang |
|---|---|---|---|---|
| MarketsandMarkets | $24,84B | ~$25,8B | 3.8% | Gesamte Wertschöpfungskette |
| Mordor-Nachrichtendienst | 225,68 kt | 238,8 kt | 5.81% (Volumen) | Mengenbasiert |
| Technavio | — | — | 5.9% | Metallmarkt |
| Datamintelligence | $32.49B | ~$34,8B | 7.10% | Breites Anwendungsspektrum |
| Fortune Business Insights | $2.79B | $2.96B | 6.28% | Nur Metal (eng gefasst) |
Die große Bandbreite der CAGR-Schätzungen – von 3,81 TP3T bis 7,11 TP3T – spiegelt echte Unsicherheit hinsichtlich der Nachfrageentwicklung wider, nicht nur methodische Unterschiede. Das konservative Szenario geht von anhaltenden Schwierigkeiten in der Lieferkette und einem schleppenden Produktionsaufbau in der Luft- und Raumfahrt aus. Das obere Ende geht davon aus, dass sich die Luft- und Raumfahrt bis 2027 wieder vollständig erholt, die Verteidigungsausgaben auf dem aktuellen Niveau bleiben und die Verbreitung medizinischer Implantate zunimmt.
Speziell für das Teilsegment der Titanlegierungen:
- IMARC Group: $5,4 Mrd. (2025) → $8,3 Mrd. (2034), CAGR 4,70%
- Persistence Market Research: $6,2 Mrd. (2026) → $8,8 Mrd. (2033), CAGR 5,1%
- Bericht der Mordor Intelligence über Legierungen: 158,23 kt (2025) → 214,35 kt (2031), CAGR 5,19%
Diese drei Zahlen stimmen weitgehend überein – der Markt für reine Legierungen wird im Jahr 2026 bei $5–7 Milliarden liegen und jährlich um etwa 5% wachsen. Das ist die Zahl, an der sich die meisten Werkstoffingenieure und Legierungskäufer orientieren sollten.
Prognose für den Titanmarkt bis 2030: Drei Szenarien
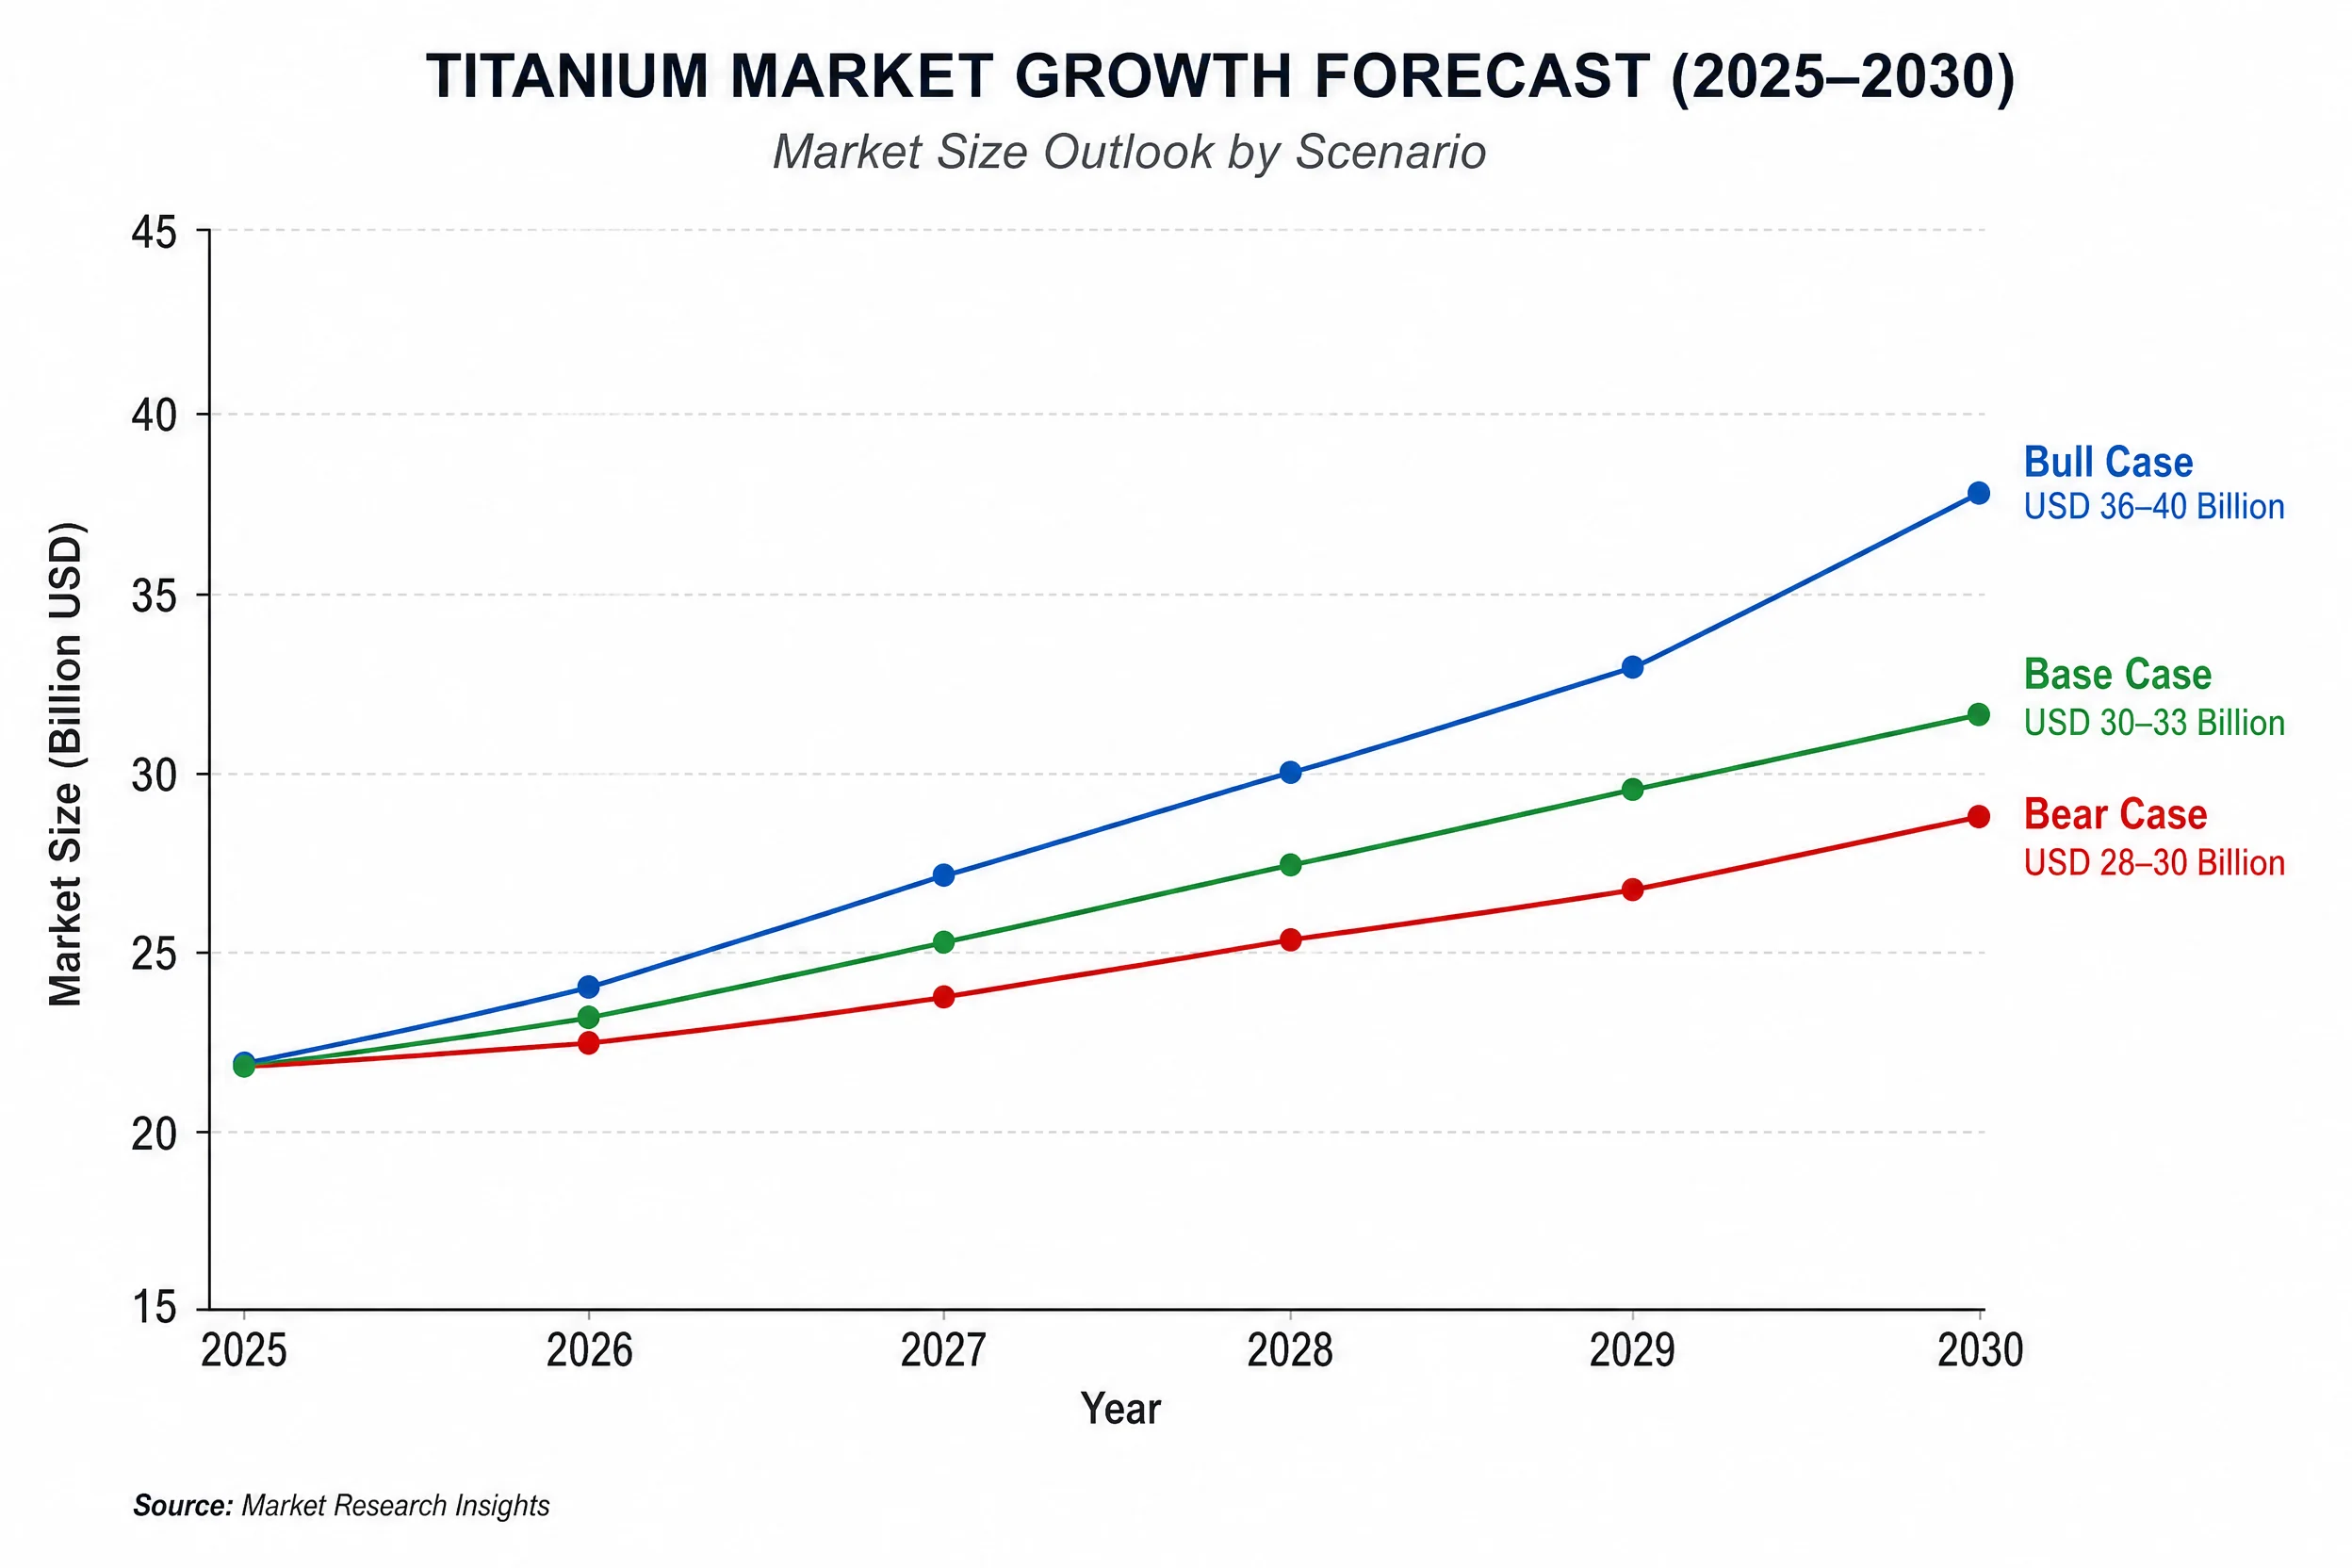
Anstatt eine einzige Prognose als Tatsache darzustellen, lassen die Daten drei plausible Entwicklungsverläufe zu:
| Szenario | CAGR 2025–2030 | Marktvolumen 2030 | Wesentliche Annahmen |
|---|---|---|---|
| Bär / Abwärtstrend | 2,81 TP3T – 3,81 TP3T | $28B – $30B | Die Produktion in der Luft- und Raumfahrt bleibt eingeschränkt, Chinas Exportkontrollen treten in Kraft, Zölle dämpfen das Handelsvolumen |
| Grundlage / Konsens | 4,51 TP3T – 5,51 TP3T | $31B – $33B | Allmähliche Erholung in der Luft- und Raumfahrt, stabile Nachfrage im medizinischen Bereich, verhaltene Verbreitung der additiven Fertigung |
| Bull / Aufwärtstrend | 6,51 TP3T – 7,11 TP3T | $36B – $40B | Normalisierung der Produktion bei Boeing/Airbus, Anstieg der Verteidigungsausgaben, Beschleunigung des Additive-Manufacturing-Volumens, zunehmende Nutzung im Elektrofahrzeug- und Energiesektor |
Die in Branchenberichten am häufigsten zitierte Einzelzahl ist die Basisszenario: ~$29–30 Milliarden bis 2030 (MarketsandMarkets) unter Verwendung einer CAGR von 3,81 TP3T. Angesichts der aktuellen Auftragsbestände in der Luft- und Raumfahrt ist diese Zahl wahrscheinlich konservativ angesetzt, stellt jedoch gleichzeitig die am besten zu begründende Zahl für Präsentationen vor dem Vorstand dar, da sie auf der transparentesten Methodik basiert.
Was könnte den Markt in Richtung eines Bullen-Szenarios treiben?
- Normalisierung der Produktion der Boeing 737 MAX und 787 (beide Modelle weisen einen hohen Titananteil auf)
- Der Ausbau der europäischen Verteidigungsindustrie treibt die Nachfrage nach Bauteilen aus Ti-6Al-4V an
- Schnelle Verbreitung von Titan in Batteriegehäusen für Elektrofahrzeuge und Wasserstoffspeichersystemen
Was sorgt dafür, dass es im Bärenbereich bleibt?
- China verhängt Exportkontrollen für Titanprodukte (Präzedenzfall bei Gallium und Germanium in den Jahren 2023–2024)
- Anhaltende Störungen in der Lieferkette der Luft- und Raumfahrt verhindern eine Erholung der OEM-Preise
- Substitutionsdruck durch Aluminiumlegierungen und Kohlefaserverbundwerkstoffe in kostenkritischen Anwendungen
Welche Branchen treiben die Nachfrage nach Titan an? Aufschlüsselung nach Anwendungsbereichen
Die Luft- und Raumfahrtbranche ist der größte Abnehmer von Titan – doch die Situation ist differenzierter, als die meisten Marktberichte vermuten lassen.
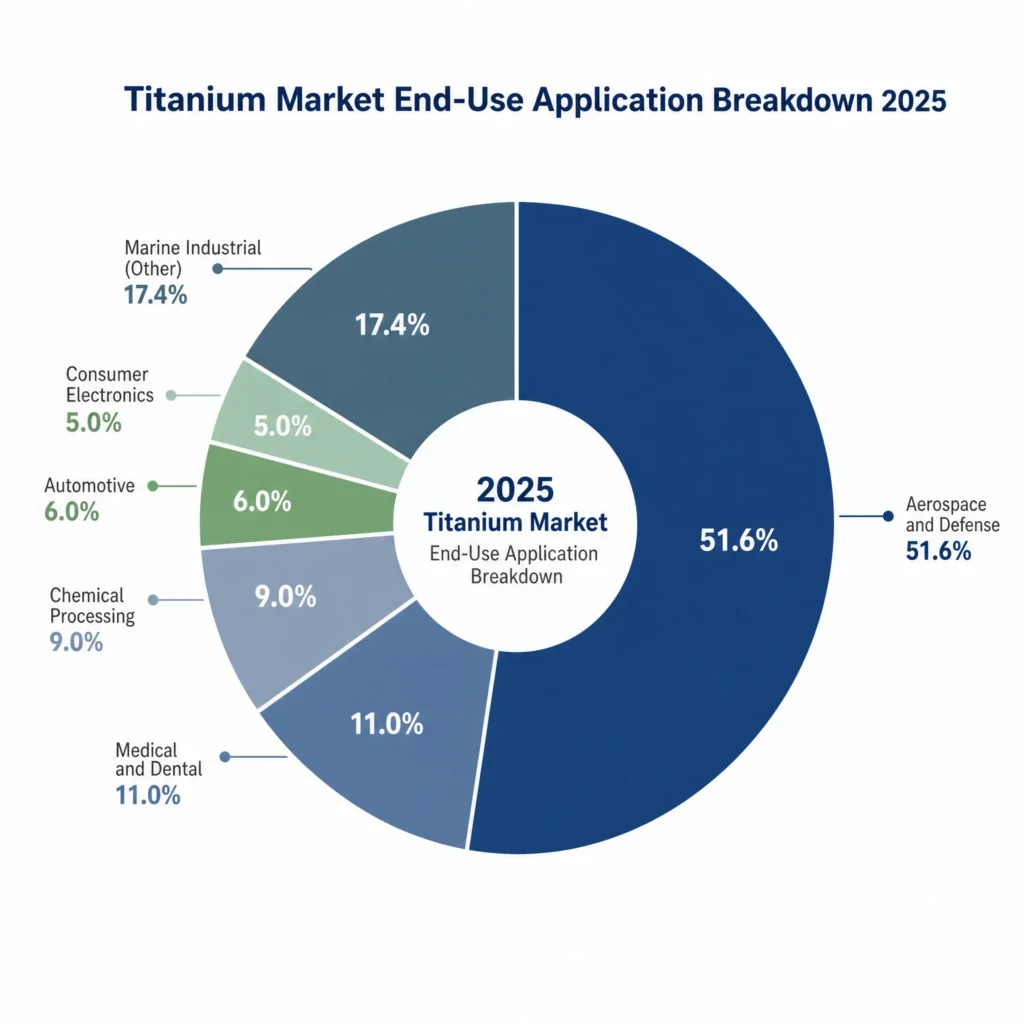
Nach Angaben von Mordor-Nachrichtendienst, Die Luft- und Raumfahrt sowie die Verteidigungsindustrie hatten im Jahr 2025 einen Marktanteil von 51,63% am gesamten Titanmarkt.. Auf dem legierungsspezifischen Markt ist die Konzentration sogar noch höher: Die Luft- und Raumfahrtbranche nimmt 68.10% aus dem Segment der Titanlegierungen (Bericht der Mordor-Geheimdienstabteilung über Legierungen).
Diese Konzentration ist aus zwei Gründen von Bedeutung. Erstens ist die Luft- und Raumfahrtbranche stark zyklisch – die Produktionsraten von Boeing und Airbus wirken sich direkt auf den Titanmarkt aus. Zweitens sind die Spezifikationen in der Luft- und Raumfahrt äußerst anspruchsvoll (beispielsweise AMS 4928 für Ti-6Al-4V-Bleche), was bedeutet, dass eine Substitution von Titan nur langsam voranschreitet, selbst wenn die Preise stark ansteigen.
Die Endverbrauchsnachfrage lässt sich wie folgt aufschlüsseln:
| Segment | Marktanteil (2025) | CAGR (2025–2031) | Wichtigste Anwendungsbereiche |
|---|---|---|---|
| Luft- und Raumfahrt & Verteidigung | 51,61 TP3T (insgesamt) / 68,11 TP3T (Legierung) | ~5.2% | Flugzeugzellen, Triebwerkskomponenten, Befestigungselemente, Fahrwerk |
| Medizinisch und zahnmedizinisch | ~10–12% | 6.15% (am schnellsten wachsend) | Orthopädische Implantate, Zahnimplantate, chirurgische Instrumente |
| Chemische Verarbeitung | ~9% | ~4.5% | Wärmetauscher, Reaktoren, Entsalzungsanlagen |
| Automobilindustrie | ~6% | ~4.8% | Auspuffanlagen, Federbeine, Pleuelstangen |
| Konsumgüter / Elektronik | ~5% | ~5.5% | Smartphone-Rahmen, Laptop-Gehäuse, Sportartikel |
| Schifffahrt / Industrie | Restbetrag | ~4.0% | Offshore-Ausrüstung, Rohrleitungen, Ventile |
Dem medizinischen Bereich gebührt besondere Aufmerksamkeit. Mit einer durchschnittlichen jährlichen Wachstumsrate (CAGR) von 6,151 TP3T übertrifft er das Gesamtmarktwachstum. Zwei strukturelle Treiber: eine alternde Weltbevölkerung (insbesondere in Japan, Deutschland und Nordamerika) und die zunehmende Verwendung von Titanimplantaten in Schwellenländern wie China, Indien und Brasilien, wo das Volumen orthopädischer Eingriffe jährlich im zweistelligen Bereich wächst. Ti-6Al-4V ELI (Extra Low Interstitial – AMS 4930) ist die vorherrschende medizinische Güteklasse und erzielt einen erheblichen Preisaufschlag gegenüber dem Standard-Ti-6Al-4V für die Luft- und Raumfahrt.
Für Einkäufer aus der Luft- und Raumfahrt: Der Boeing 787 Dreamliner besteht aus etwa 15%-Titan nach Leergewicht — etwa 36.000 bis 39.000 Pfund pro Flugzeug, wie aus einem Bericht von Reuters über die Materialzusammensetzung bei Boeing hervorgeht. Angesichts des gesamten Auftragsbestands bei der Produktion von Großraumflugzeugen von Boeing und Airbus führt jede Beschleunigung der Produktionsrate zu einer raschen Verknappung auf dem Markt für Titanlegierungen. Der Airbus A350 weist einen ähnlich hohen Titananteil auf.
Additive Fertigung: Der am schnellsten wachsende Nachfragefaktor für Titan
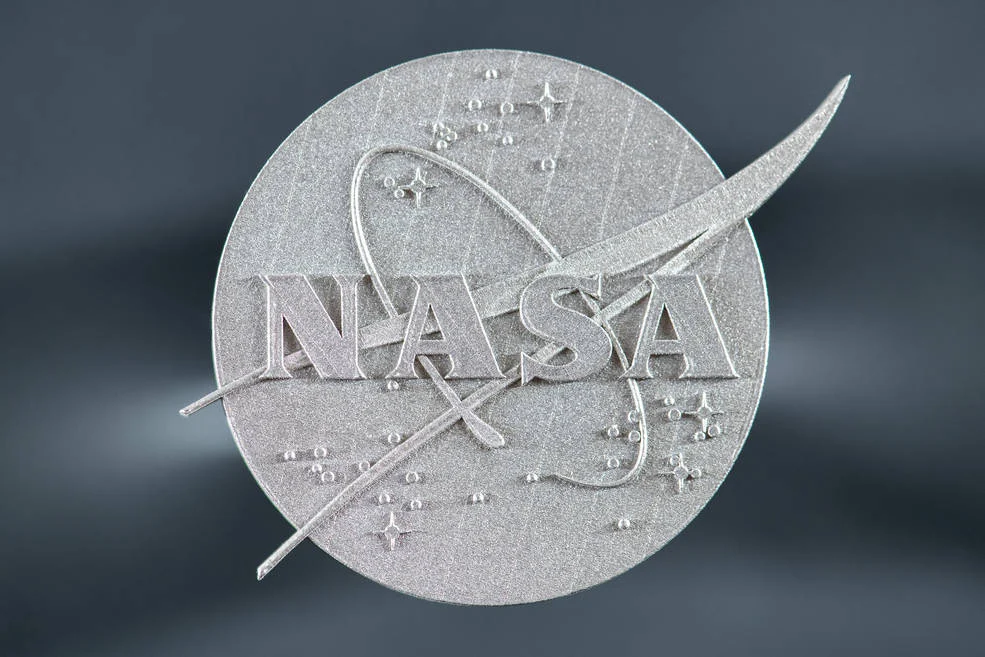
Genau hier verschweigen die meisten Marktberichte das Wesentliche. Der Markt für Titanpulver – den Ausgangsstoff für die additive Fertigung (AM) – wächst um 14.821 TP3T – durchschnittliche jährliche Wachstumsrate (CAGR) bis 2034, laut Prioritätsforschung. Das entspricht dem Doppelten oder Dreifachen der Wachstumsrate des Marktes für herkömmliches Titan.
Der breiter gefasste Markt für 3D-Druckmetalle untermauert dies: MarketsandMarkets prognostiziert für 2025 einen Wert von $1,19 Milliarden, der bis 2030 auf $3,62 Milliarden ansteigen soll, bei 25,01 TP3T CAGR, wobei Titan den größten Anteil am Gesamtvolumen ausmacht.
Warum ist das für die Marktprognose von Bedeutung?
Die additive Fertigung verändert die Nachfragestruktur in dreierlei Hinsicht:
- Die Near-Net-Shape-Fertigung senkt das „Buy-to-Fly“-Verhältnis. Bei der herkömmlichen Bearbeitung von Titanbauteilen für die Luft- und Raumfahrt liegt das „Buy-to-Fly“-Verhältnis zwischen 6:1 und 20:1 – das bedeutet, dass pro 1 Pfund Fertigteil 6 bis 20 Pfund Titan als Ausgangsmaterial benötigt werden. Durch die additive Fertigung (AM) lässt sich dieses Verhältnis auf etwa 1,5:1 bis 3:1 senken. Dies könnte die Gesamtnachfrage nach Titanmassen verringern, selbst wenn die Anzahl der titanhaltigen Bauteile steigt.
- Neue Geometrien eröffnen neue Anwendungsmöglichkeiten. AM ermöglicht komplexe interne Kühlkanäle und Gitterstrukturen, die mit der Umformung nicht realisierbar sind. Dadurch wird der Einsatz von Titan in Anwendungsbereichen – Satellitenkomponenten, medizinische Gerüste, Hochleistungsbauteile für die Automobilindustrie – möglich, in denen es bisher aufgrund der hohen Kosten nicht zum Einsatz kam.
- Es entstehen separate Lieferketten. AM-Pulver erfordert andere Spezifikationen als Walzprodukte. Sphärisches Ti-6Al-4V-Pulver für LPBF-Verfahren (Laser Powder Bed Fusion) wird zu einem deutlich höheren Preis gehandelt als herkömmliche Knetlegierungen. Dadurch entsteht ein paralleles, schneller wachsendes Marktsegment, das getrennt von herkömmlichen Walzprodukten erfasst wird.
3D-Druck in der Luft- und Raumfahrt sowie im Verteidigungsbereich wird voraussichtlich erreichen $12,41 Milliarden bis 2031, gegenüber $4,19 Milliarden im Jahr 2025 (Mordor Intelligence), bei einer durchschnittlichen jährlichen Wachstumsrate (CAGR) von 19,83%. Titan-AM-Bauteile – Halterungen, Rohrleitungen, Strukturbauteile – spielen bei diesem Wachstum eine zentrale Rolle.
Praktische Auswirkungen auf die Beschaffung: Falls Ihre Entwicklungsteams auf eine AM-basierte Fertigung umstellen, sollten Sie bereits jetzt mit der Qualifizierung von Pulverlieferanten beginnen. Der Zertifizierungsprozess für AM-Titanbauteile in der Luft- und Raumfahrt ist langwieriger als bei herkömmlichen Schmiedeteilen, und es gibt nur wenige qualifizierte Pulverlieferketten.
Die Lage bei den Versorgungsrisiken: Chinas „75%“-Strategie und ihre Bedeutung
Keine Betrachtung der Marktprognose für Titan ist vollständig, ohne die Angebotsseite zu beleuchten – und die Angebotsseite weist ein ernstes Konzentrationsproblem auf.
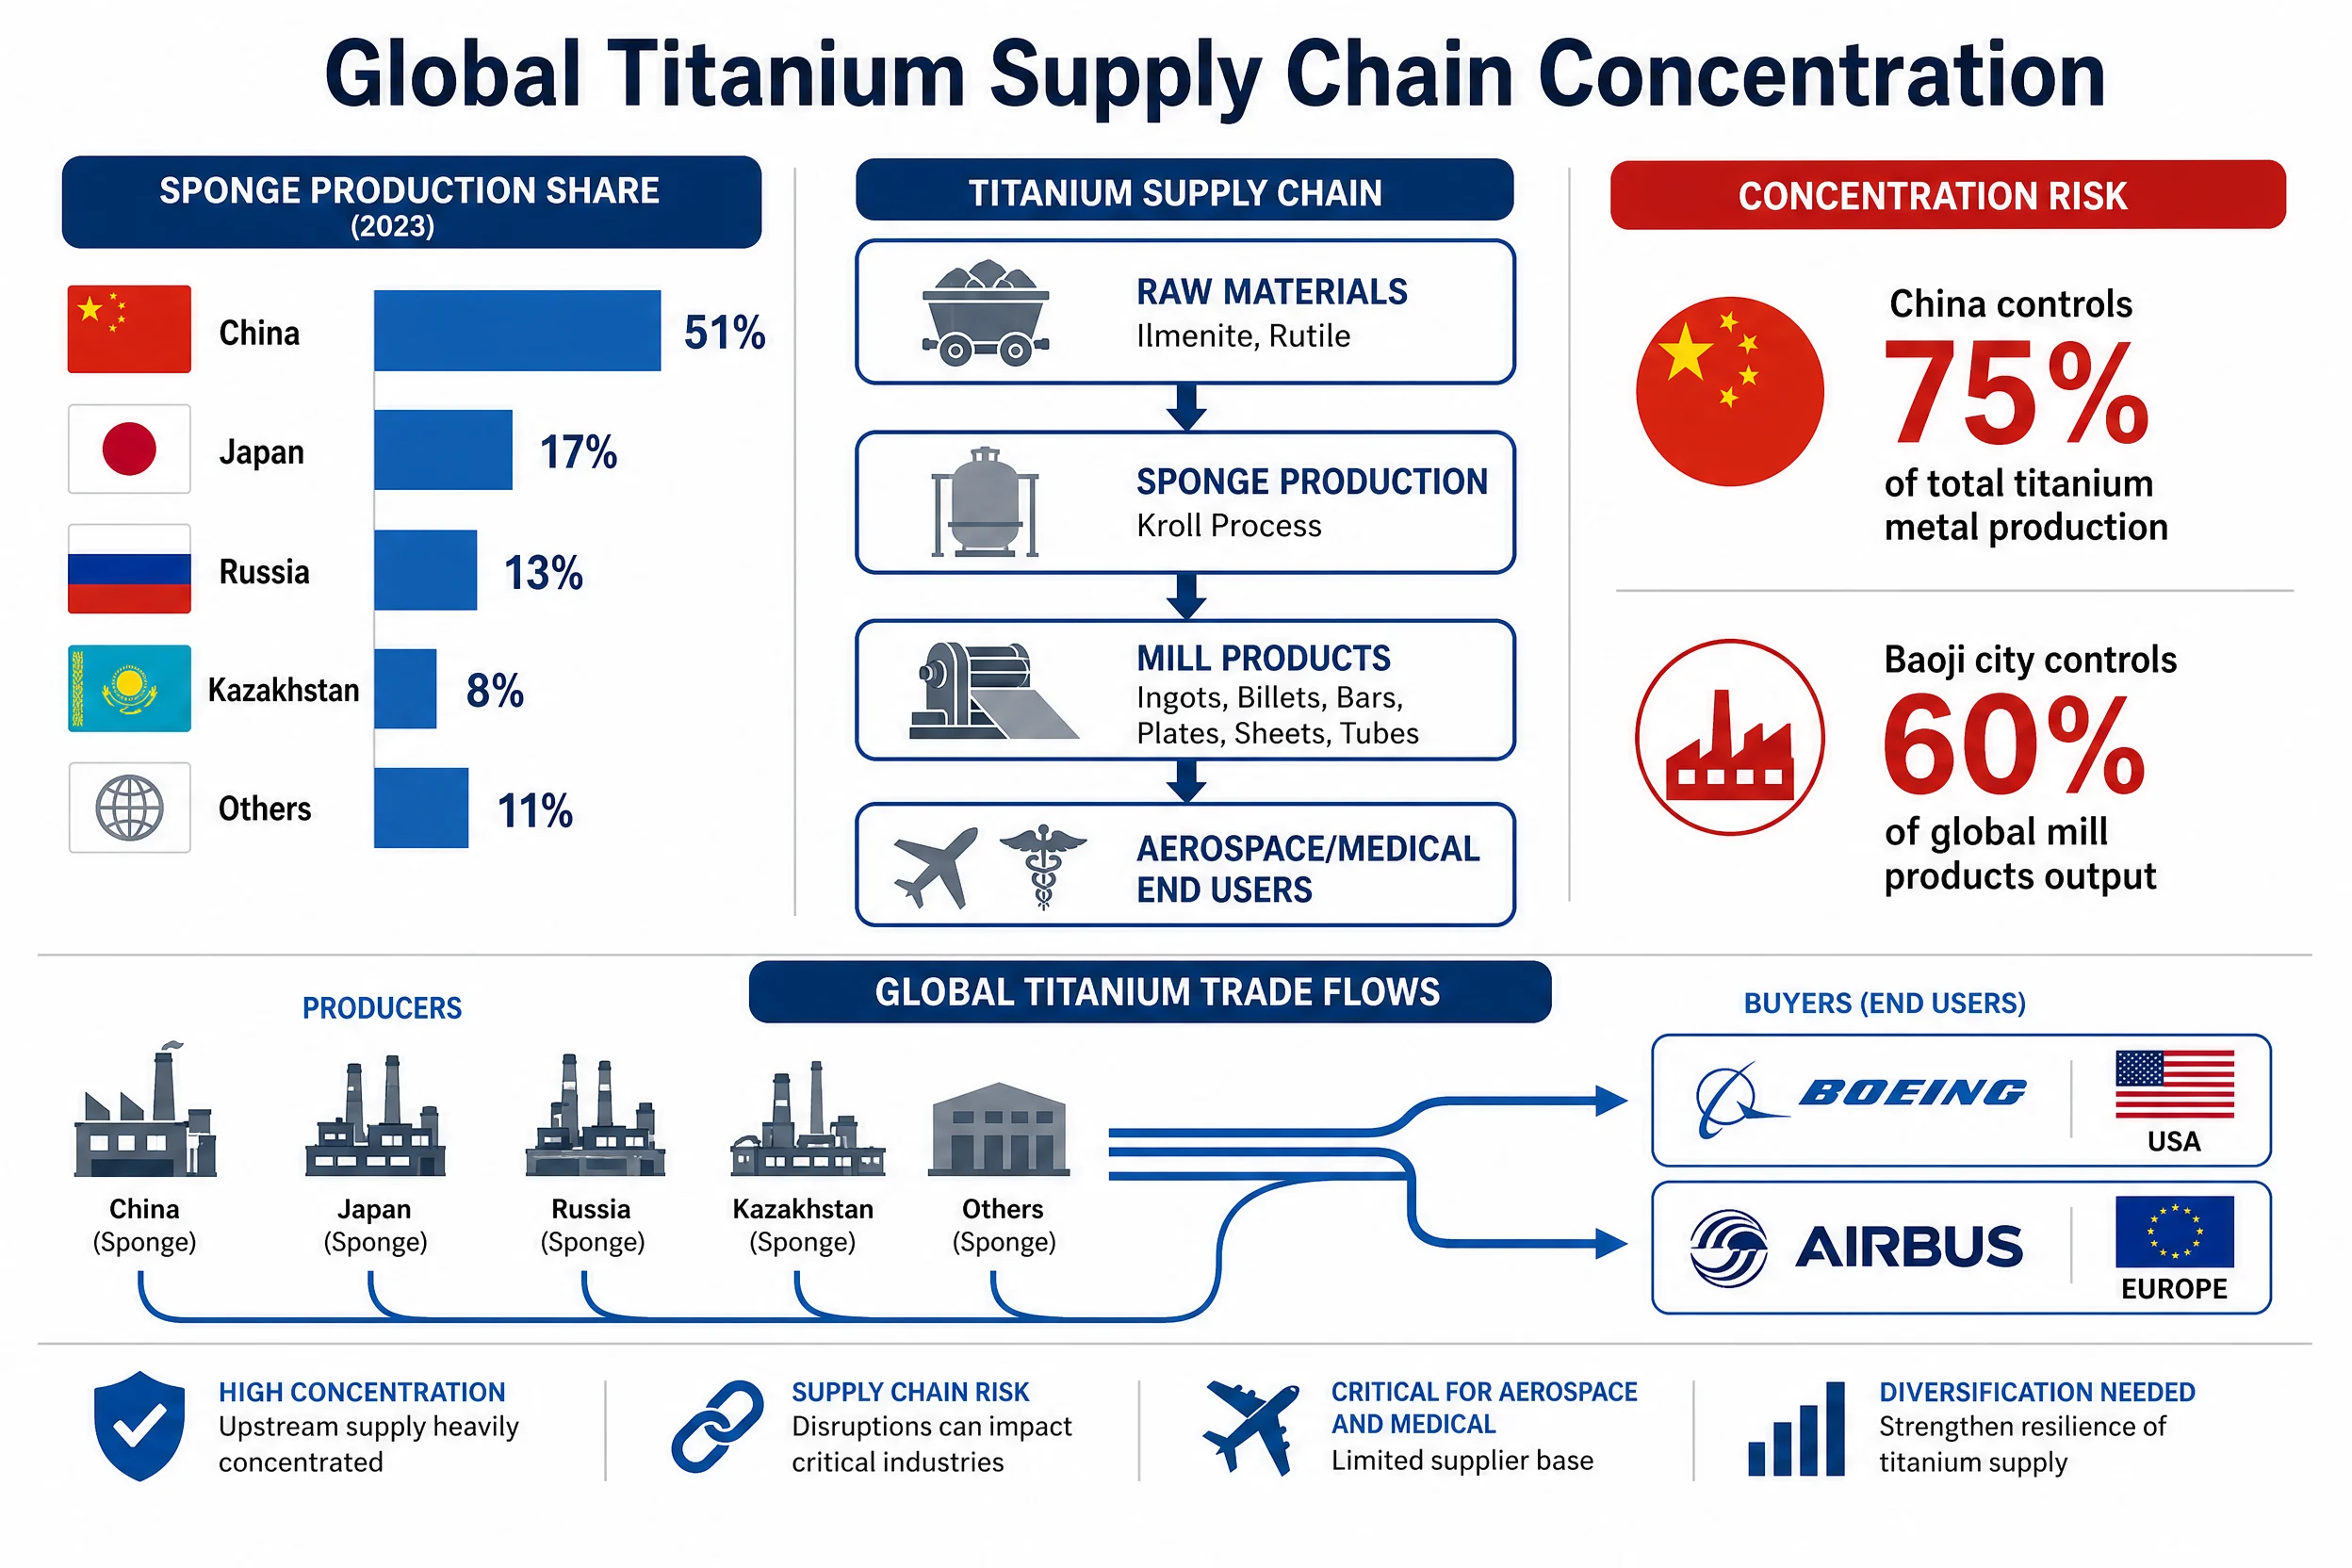
Laut einer Analyse von nai500.com, Chinas Anteil an der weltweiten Titanmetallproduktion stieg von etwa Von 401 TP3T im Jahr 2019 auf über 751 TP3T bis zum Jahr 2025. Das ist kein schrittweiser Wandel – es handelt sich um einen strukturellen Wandel, der durch massive inländische Investitionen in die Produktionskapazitäten für Schwammguss und Legierungen vorangetrieben wurde, während westliche Hersteller sich aus diesem Bereich zurückzogen.
Die Lieferkette weist mehrere Engpässe auf:
| Bühne | Schwerpunkt | Risikostufe |
|---|---|---|
| Titanerz (Ilmenit/Rutil) | Australien, Südafrika, Kanada (relativ breit gefächert) | Niedrig |
| TiO₂-Ausgangsmaterial | China dominiert den Pigmentmarkt | Mittel |
| Titanschwamm | China 51%, Japan 17%, Russland 13% (Aviation Week) | Hoch |
| Titanwalzprodukte | Baoji, China: ca. 60% des weltweiten Angebots (titaniumyx.com) | Sehr hoch |
| Legierung in Luft- und Raumfahrtqualität | VSMPO (Russland) war im Westen lange Zeit marktbeherrschend; wird nun verdrängt | Kritisch |
Die Russland-Dimension fügt eine zweite Ebene hinzu. QuestMetals stellt fest, dass Russland die “entscheidende Midstream-Wertschöpfungskette für Titanschwamm” dominiert hat – und dass VSMPO-AVISMA, Russlands führender Titanproduzent, vor dem Ukraine-Konflikt ein Hauptlieferant für Boeing und Airbus war. Westliche Erstausrüster haben aktiv nach alternativen Bezugsquellen gesucht, doch die Qualifizierung dauert zwei bis vier Jahre, und die Lieferkapazitäten aus Japan, den USA (ATI, TIMET) und Australien sind begrenzt.
Die Konzentration in Baoji verdient einen eigenen Absatz. Titaniumyx.com Demnach liefert die Stadt Baoji in der Provinz Shaanxi fast 60% der weltweit produzierten Titanwalzprodukte. Das ist eine einzige Stadt. Jede Störung – sei es durch Handelssanktionen, Exportkontrollen oder eine Änderung der Innenpolitik – hätte unmittelbare Auswirkungen auf die globalen Lieferketten in der Luft- und Raumfahrt sowie in der Industrie.
Eine Analyse des Präzedenzfalls der chinesischen Exportkontrollen: Peking führte im August 2023 Exportkontrollen für Gallium und Germanium sowie im Dezember 2023 für Graphit ein. Titan rangiert bei reinen Konzentrationskennzahlen auf Erzebene hinter Seltenen Erden und Wolfram, liegt jedoch deutlich höher, wenn die Konzentration nach der Verarbeitung gemessen wird. Das Risiko ist nicht hypothetisch.
Was Käufer tun sollten:
- Überprüfen Sie Ihre Abhängigkeiten von Tier-2- und Tier-3-Zulieferern hinsichtlich des Risikos durch chinesische Walzprodukte
- Die Qualifizierung alternativer Rohstoffquellen für Schwammgummi beschleunigen (Japan, Kasachstan, neue Produktionskapazitäten in Australien)
- Erwägen Sie strategische Lagerpuffer für Luft- und Raumfahrtlegierungen mit langen Lieferzeiten (Ti-6Al-4V, Ti-3Al-2,5V).
- Beobachtung der Informationskanäle zu kritischen Mineralien, um Frühwarnsignale hinsichtlich Entwicklungen im Bereich der Exportkontrollen zu erkennen
Aufschlüsselung nach regionalen Märkten
Der asiatisch-pazifische Raum ist weltweit führend bei der Titanproduktion und nimmt auch beim Verbrauch zunehmend eine führende Rolle ein.
| Region | Rolle in der Produktion | Verbrauchsrolle | Wichtige Dynamiken |
|---|---|---|---|
| Asien-Pazifik | Dominant (Produktion in China: 75%+) | Größter und am schnellsten wachsender | Ausbau der heimischen Luft- und Raumfahrtindustrie, Herstellung medizinischer Geräte, Elektronik |
| Nordamerika | Sekundarstufe (ATI, TIMET, Allegheny) | Groß, mit Schwerpunkt auf der Luft- und Raumfahrt | Verteidigungsausgaben stützen die Nachfrage; das AM-Ökosystem wächst |
| Europa | Geringe Produktion (etwas Schwamm, erhebliche Mengen an Legierungen) | Bedeutende Unternehmen aus der Luft- und Raumfahrt sowie der Industrie | Die Lieferkette von Airbus; Hochfahren der Rüstungsproduktion nach dem Ukraine-Konflikt |
| Russland/GUS | Historisch bedeutender Schwamm (mittlerweile im Westen zugelassen) | Verwendung im Bereich der Landesverteidigung | Geopolitische Isolation von den westlichen Märkten |
| Naher Osten / Rest der Welt | Aufstrebend (Investitionen im Rahmen der „Saudi Vision 2030“) | Wachsen | Öl und Gas, Meerwasserentsalzung, aufstrebende Luft- und Raumfahrtindustrie |
Die Markt für die Titanbearbeitung in der Luft- und Raumfahrt im asiatisch-pazifischen Raum Der Markt wurde im Jahr 2025 auf $2,84 Milliarden geschätzt und soll bis 2034 mit einer durchschnittlichen jährlichen Wachstumsrate (CAGR) von etwa 9% wachsen – dies ist die höchste Wachstumsrate aller regionalen Segmente. Treiber hierfür sind Chinas COMAC-C919-Programm und die allgemeinen Ambitionen des Landes im Bereich der Luftfahrt.
Nordamerika ist nach wie vor der größte Einzelmarkt für Hochleistungs-Titanlegierungen, angetrieben von Boeing, Lockheed Martin, Northrop Grumman und SpaceX – allesamt bedeutende Abnehmer von Ti-6Al-4V. Die USA haben im Rahmen von vom Verteidigungsministerium finanzierten Programmen in die Sicherung der inländischen Produktionskapazitäten für Titanschwamm investiert, doch bis zur vollständigen Unabhängigkeit von asiatischen Lieferungen sind es noch Jahre.
Wichtige Titanproduzenten und Marktakteure
Die Titanindustrie konzentriert sich auf eine relativ kleine Anzahl globaler Hersteller:
| Unternehmen | Land | Wichtigste Produkte | Anmerkungen |
|---|---|---|---|
| VSMPO-AVISMA | Russland | Schwamm, Legierungsblech, Schmiedeteile | Größter historischer Produzent; Umsatz im Westen nach 2022 stark zurückgegangen |
| ATI (Allegheny Technologies) | USA | Legierungsbleche, -platten, -stangen, -schmiedeteile | Führender US-amerikanischer Zulieferer für die Luft- und Raumfahrtindustrie |
| TIMET (Titanium Metals Corp.) | USA | Schwamm, Walzprodukte aus Legierungen | Im Besitz von Precision Castparts / Berkshire Hathaway |
| BAOTI-Gruppe | China | Gesamte Wertschöpfungskette | Mit Sitz in Baoji; marktführend bei Walzprodukten weltweit |
| Toho Titanium / OSAKA Titanium | Japan | Schwamm | Wichtige Lieferanten von Schwämmen außerhalb Chinas |
| IperionX | USA/Australien | Schwamm (im Entstehen begriffen) | Vom Verteidigungsministerium unterstützte Initiative zur Stärkung der inländischen Produktionskapazitäten |
| KOBELCO | Japan | Walzprodukte aus Legierungen | Umfangreiche Zulieferung für die Luft- und Raumfahrt |
Die Wettbewerbslandschaft hat sich seit 2022 verändert. Westliche Erstausrüster, die zuvor bei VSMPO eingekauft haben, beziehen ihre Produkte nun entweder von US-amerikanischen oder japanischen Herstellern (zu höheren Kosten) oder von chinesischen Herstellern (mit Bedenken hinsichtlich geopolitischer Risiken). Diese Zweiteilung ist mindestens bis 2030 ein strukturelles Merkmal des Marktes.
Was diese Prognosen für Einkäufer und Beschaffungsteams bedeuten
Marktgrößenangaben sind nützlich, um Trends zu erkennen, doch die Beschaffungsteams müssen sie in operative Entscheidungen umsetzen. Folgendes lassen die Daten tatsächlich erkennen:
1. Rechnen Sie mit einem moderaten Preisdruck, nicht jedoch mit einem Preisanstieg – es sei denn, es kommt zu einer Versorgungsunterbrechung.
Ein Markt mit einer durchschnittlichen jährlichen Wachstumsrate (CAGR) von 3,81 TP3T–5,51 TP3T, der parallel zu einem stetigen Kapazitätsausbau wächst, verschafft den Anbietern keine Preissetzungsmacht. Die Titanpreise sind seit 2018 real relativ stabil geblieben, und die SMM-Analyse des chinesischen Marktes im Jahr 2025 beschreibt “Ungleichgewichte zwischen Angebot und Nachfrage” sowie “Druck zur Kostenweitergabe” – Formulierungen, die auf ein Überangebot und nicht auf eine Verknappung in naher Zukunft hindeuten. Jede Maßnahme Chinas zur Exportkontrolle würde jedoch sofort zu einer Verknappung des Angebots an Legierungen im Westen führen und die Preise in die Höhe treiben.
2. Bei Titan in medizinischer Qualität herrscht ein Verkäufermarkt.
Die CAGR von 6,15% im Bereich medizinischer Anwendungen in Verbindung mit strengen Spezifikationen für ELI-Qualitätsstufen und einer begrenzten Anzahl qualifizierter Hersteller bedeutet, dass Hersteller medizinischer Geräte mit zunehmend wettbewerbsintensiven Beschaffungsbedingungen konfrontiert sein werden. Langfristige Lieferverträge sind hier sinnvoll.
3. Der Markt für Titanpulver erfordert eine andere Strategie bei der Beschaffung.
Die üblichen Beschaffungsbeziehungen für Walzprodukte lassen sich nicht auf die Beschaffung von Pulver für die additive Fertigung übertragen. Die Zahl der qualifizierten Lieferanten für kugelförmiges Ti-6Al-4V-Pulver in Luft- und Raumfahrtqualität ist begrenzt. Beginnen Sie frühzeitig mit den Qualifizierungsprozessen – für luft- und raumfahrtzertifizierte AM-Bauteile sind mindestens 18 bis 24 Monate einzuplanen.
4. Bauen Sie schon jetzt eine geografische Diversifizierung in die Lieferanten-Scorecards ein.
Angesichts der Produktionsdominanz Chinas mit 751 TP3T und der Produktion von Walzprodukten in Baoji in Höhe von 601 TP3T ist das Risiko einer geografischen Konzentration zu einem Standardthema bei Wirtschaftsprüfungen geworden. Viele Tier-1-Zulieferer der Luft- und Raumfahrtindustrie haben bereits Anfragen von Kunden erhalten, ihre Titan-Engagements in China zu dokumentieren.
5. Die Zahl $30B 2030 stellt eine Untergrenze dar, keine Obergrenze – sofern sich die Lage in der Luft- und Raumfahrt normalisiert.
Der kombinierte Auftragsbestand von Boeing und Airbus entspricht bei den derzeitigen Produktionsraten einem Titannachfragebedarf von über einem Jahrzehnt. Sollte sich die Produktion bis 2027–2028 normalisieren, wird das optimistische Szenario ($36–40 Mrd. bis 2030) glaubwürdig. Die monatlichen Auslieferungsdaten beider Erstausrüster sind der beste Frühindikator, den es zu beobachten gilt.
Häufig gestellte Fragen: FAQ zum Titanmarkt
Wie groß wird der weltweite Titanmarkt im Jahr 2026 sein?
Der weltweite Titanmarkt (Wertschöpfungskette für Metall und Legierungen, ohne TiO₂-Pigmente) wird auf etwa $25–26 Milliarden im Jahr 2026, basierend auf den Zahlen von MarketsandMarkets, die für 2025 einen Wert von $24,84 Milliarden bei einer durchschnittlichen jährlichen Wachstumsrate (CAGR) von 3,8% angeben. Umfassendere Schätzungen, die Titandioxid einbeziehen, können für dasselbe Jahr $32 Milliarden übersteigen.
Wie hoch ist die durchschnittliche jährliche Wachstumsrate (CAGR) der Titanindustrie?
Die CAGR-Schätzungen für den Zeitraum 2025–2030 reichen von 3,81 TP3T (MarketsandMarkets, Metall-Wertschöpfungskette) bis 7,11 TP3T (Datamintelligence, weiter gefasster Umfang). Für das Teilsegment Titanlegierungen liegen bei mehreren Marktforschungsunternehmen einheitliche Schätzungen für eine CAGR von 4,71 TP3T bis 5,21 TP3T für den Zeitraum 2031–2034 vor.
Welches Land produziert das meiste Titan?
China ist mit Abstand der größte Produzent und wird im Jahr 2025 etwa 75% der weltweiten Titanmetallproduktion ausmachen, gegenüber rund 40% im Jahr 2019. Speziell bei Titanschwamm hält China einen Anteil von rund 51%, gefolgt von Japan (17%) und Russland (13%).
Welcher Sektor treibt die Nachfrage nach Titan am stärksten an?
Die Luft- und Raumfahrt sowie die Verteidigungsindustrie sind die dominierenden Endverwendungsbereiche und machen im Jahr 2025 51,6% des gesamten Titanmarktes sowie 68,1% des Marktes für Titanlegierungen aus. Das medizinische Segment ist der am schnellsten wachsende Anwendungsbereich mit einer prognostizierten durchschnittlichen jährlichen Wachstumsrate (CAGR) von 6,15% bis 2031.
Werden die Titanpreise bis 2030 deutlich steigen?
Im Basisszenario wird angesichts des stetigen Kapazitätsausbaus bei gleichzeitigem Nachfragewachstum mit moderaten Preisanstiegen gerechnet. Ein deutlicher Preisanstieg würde eine Versorgungsunterbrechung erfordern – höchstwahrscheinlich chinesische Exportbeschränkungen oder einen erheblichen Produktionsanstieg in der Luft- und Raumfahrt, der die Fristen für die Zulassung der Lieferungen übersteigt.
Warum wird in der Luft- und Raumfahrt so viel Titan verwendet?
Die Kombination aus hohem Festigkeits-Gewichts-Verhältnis (vergleichbar mit Stahl bei etwa 40–45% geringerem Gewicht), Korrosionsbeständigkeit und Hochtemperaturbeständigkeit macht Titan in den Heißbereichen von Strahltriebwerken, Flugzeugzellen und Befestigungselementen unersetzlich. Die Boeing 787 besteht, gemessen am Leergewicht, zu etwa 15% aus Titan – das entspricht etwa 36.000–39.000 lbs pro Flugzeug.
Gilt Titan als kritischer Werkstoff für die US-Verteidigung?
Ja. Das US-Verteidigungsministerium hat Titan als strategischen und kritischen Werkstoff eingestuft. Die Initiativen zur Sicherung der inländischen Versorgung in den 2020er Jahren – darunter die Finanzierung der US-amerikanischen Schwammmetallproduktion von IperionX und die Kapazitätsinvestitionen von ATI – spiegeln die Besorgnis des Verteidigungsministeriums hinsichtlich der Abhängigkeit von chinesischen Lieferketten bei Komponenten für den Militär- und Verteidigungsluftfahrtbereich wider.
Zusammenfassung
Der Titanmarkt hat ein Volumen von etwa $25–26 Milliarden im Jahr 2026 auf der Ebene der Metall-Wertschöpfungskette – mit einer durchschnittlichen jährlichen Wachstumsrate (CAGR) von 4%–5,5% in Richtung $30–33 Milliarden bis 2030. Die in verschiedenen Marktforschungsberichten angegebenen Spannen ($3B bis $57B) sind auf ein Problem bei der Definition des Erfassungsbereichs zurückzuführen und nicht auf ein Problem mit der Datenqualität; jeder seriöse Analyst muss diese Zahlen abgleichen, bevor er sie zitiert.
Die strukturelle Entwicklung ist wichtiger als die Gesamtzahl. Die Luft- und Raumfahrt macht mehr als die Hälfte der Gesamtnachfrage aus und ist weiterhin konjunkturell an die Produktionsraten von Boeing und Airbus gekoppelt. Der Medizinbereich ist mit einer CAGR von 6,15% das am schnellsten wachsende Segment. Titanpulver für die additive Fertigung ist mit einer CAGR von 14,82% das am schnellsten wachsende Teilsegment – ein aufstrebender Markt innerhalb eines Marktes. Und Chinas Produktionsdominanz von 75% ist bis 2030 die größte einzelne Risikovariable für jeden westlichen Abnehmer.
Die Auswirkungen auf die Beschaffung sind konkret: Diversifizieren Sie die geografische Beschaffung jetzt, beginnen Sie mit der Qualifizierung von AM-Pulverlieferanten, falls Sie dies noch nicht getan haben, und nutzen Sie die Basisprognose ($29–30B bis 2030) als Planungsuntergrenze, während Sie Stresstests für den Worst-Case-Szenario (chinesische Exportkontrollen, anhaltende Störungen in der Luft- und Raumfahrt) durchführen.